


 所有回答列表(2)

最代码官方 LV168
2014年10月14日
软件性能测试需要在已知的硬件配置和软件参数配置下测试才有意义。
最代码的服务器是单核,2g内存
tomcat中jvm参数配置:
1 | JAVA_OPTS="$JAVA_OPTS -server -Xms256m -Xmx1024m -XX:NewSize=128m -XX:MaxNewSize=128m -XX:PermSize=128m -XX:MaxPermSize=128m -XX:+DisableExplicitGC" |
运行结果:
01 | [root@AY131127173600769912Z local]# ab -c 20 -t 10 "http://www.zuidaima.com/" |
02 | This is ApacheBench, Version 2.0.40-dev <$Revision: 1.146 $> apache-2.0 |
03 | Copyright 1996 Adam Twiss, Zeus Technology Ltd, http://www.zeustech.net/ |
04 | Copyright 2006 The Apache Software Foundation, http://www.apache.org/ |
05 |
06 | Benchmarking www.zuidaima.com (be patient) |
07 | Finished 11 requests |
08 |
09 |
10 | Server Software: nginx/1.5.6 |
11 | Server Hostname: www.zuidaima.com |
12 | Server Port: 80 |
13 |
14 | Document Path: / |
15 | Document Length: 116427 bytes |
16 |
17 | Concurrency Level: 20 |
18 | Time taken for tests: 10.171361 seconds |
19 | Complete requests: 11 |
20 | Failed requests: 0 |
21 | Write errors: 0 |
22 | Total transferred: 1348923 bytes |
23 | HTML transferred: 1346007 bytes |
24 | Requests per second: 1.08 [#/sec] (mean) |
25 | Time per request: 18493.384 [ms] (mean) |
26 | Time per request: 924.669 [ms] (mean, across all concurrent requests) |
27 | Transfer rate: 129.48 [Kbytes/sec] received |
28 |
29 | Connection Times (ms) |
30 | min mean[+/-sd] median max |
31 | Connect: 0 1385 769.3 1872 1872 |
32 | Processing: 531 5231 2627.5 6643 7185 |
33 | Waiting: 0 4918 2838.6 6338 7040 |
34 | Total: 1872 6616 3102.1 8515 9057 |
35 |
36 | Percentage of the requests served within a certain time (ms) |
37 | 50% 8515 |
38 | 66% 8523 |
39 | 75% 8740 |
40 | 80% 8740 |
41 | 90% 8877 |
42 | 95% 9057 |
43 | 98% 9057 |
44 | 99% 9057 |
45 | 100% 9057 (longest request) |
top截图:
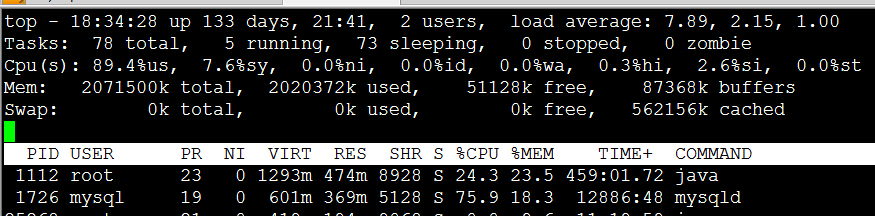
cpu已经飙到90%,响应时间50%以上8秒显然是不可接受的,所以需要在软件上做优化,当然最简单的就是升级硬件。
2014-10-24 18:00测试结果
增加ehcache机制后,同样的命令执行后截图:
01 | [root@AY131127173600769912Z ~]# ab -c 20 -t 10 "http://www.zuidaima.com/" |
02 | This is ApacheBench, Version 2.0.40-dev <$Revision: 1.146 $> apache-2.0 |
03 | Copyright 1996 Adam Twiss, Zeus Technology Ltd, http://www.zeustech.net/ |
04 | Copyright 2006 The Apache Software Foundation, http://www.apache.org/ |
05 |
06 | Benchmarking www.zuidaima.com (be patient) |
07 | Finished 136 requests |
08 |
09 |
10 | Server Software: nginx/1.5.6 |
11 | Server Hostname: www.zuidaima.com |
12 | Server Port: 80 |
13 |
14 | Document Path: / |
15 | Document Length: 125049 bytes |
16 |
17 | Concurrency Level: 20 |
18 | Time taken for tests: 10.12944 seconds |
19 | Complete requests: 136 |
20 | Failed requests: 0 |
21 | Write errors: 0 |
22 | Total transferred: 17162626 bytes |
23 | HTML transferred: 17128849 bytes |
24 | Requests per second: 13.58 [#/sec] (mean) |
25 | Time per request: 1472.492 [ms] (mean) |
26 | Time per request: 73.625 [ms] (mean, across all concurrent requests) |
27 | Transfer rate: 1673.83 [Kbytes/sec] received |
28 |
29 | Connection Times (ms) |
30 | min mean[+/-sd] median max |
31 | Connect: 0 8 21.9 0 63 |
32 | Processing: 56 1299 1285.2 874 8971 |
33 | Waiting: 0 1127 1169.9 637 8769 |
34 | Total: 56 1308 1296.5 874 9034 |
35 |
36 | Percentage of the requests served within a certain time (ms) |
37 | 50% 874 |
38 | 66% 1512 |
39 | 75% 1768 |
40 | 80% 2054 |
41 | 90% 2746 |
42 | 95% 4145 |
43 | 98% 5087 |
44 | 99% 5682 |
45 | 100% 9034 (longest request) |
可以看到性能比原先提高了不少,接下来还会继续优化。起码从软件层做到性能最大化。
2015-12-9 13:40测试结果
双核,2G内存,tomcat server.xml修改配置
01 | <?xml version="1.0" encoding="UTF-8"?> |
02 | <Server port="8005" shutdown="SHUTDOWN"> |
03 | <Listener className="org.apache.catalina.core.JasperListener"/> |
04 | <Listener className="org.apache.catalina.core.JreMemoryLeakPreventionListener"/> |
05 | <Listener className="org.apache.catalina.mbeans.ServerLifecycleListener"/> |
06 | <Service name="Catalina"> |
07 | <Executor maxThreads="500" minSpareThreads="4" name="tomcatThreadPool" namePrefix="catalina-exec-"/> |
08 | <Connector URIEncoding="UTF-8" connectionTimeout="20000" executor="tomcatThreadPool" port="8080" protocol="HTTP/1.1" redirectPort="8443"/> |
09 | <Engine defaultHost="localhost" name="Catalina"> |
10 | <Host name="localhost" |
11 | xmlValidation="false" xmlNamespaceAware="false"> |
12 | <Context docBase="/data/www/www.zuidaima.com_8080" path="/" disableURLRewriting="true" sessionCookieName="zdmid"/> |
13 | </Host> |
14 | </Engine> |
15 | </Service> |
16 | </Server> |
01 | [root@AY131127173600769912Z ~]# ab -t 10 -c 20 "http://www.zuidaima.com/" |
02 | This is ApacheBench, Version 2.0.40-dev <$Revision: 1.146 $> apache-2.0 |
03 | Copyright 1996 Adam Twiss, Zeus Technology Ltd, http://www.zeustech.net/ |
04 | Copyright 2006 The Apache Software Foundation, http://www.apache.org/ |
05 |
06 | Benchmarking www.zuidaima.com (be patient) |
07 | Finished 116 requests |
08 |
09 |
10 | Server Software: nginx/1.5.6 |
11 | Server Hostname: www.zuidaima.com |
12 | Server Port: 80 |
13 |
14 | Document Path: / |
15 | Document Length: 110272 bytes |
16 |
17 | Concurrency Level: 20 |
18 | Time taken for tests: 10.34452 seconds |
19 | Complete requests: 116 |
20 | Failed requests: 97 |
21 | (Connect: 0, Length: 97, Exceptions: 0) |
22 | Write errors: 0 |
23 | Total transferred: 12885678 bytes |
24 | HTML transferred: 12857004 bytes |
25 | Requests per second: 11.56 [#/sec] (mean) |
26 | Time per request: 1730.078 [ms] (mean) |
27 | Time per request: 86.504 [ms] (mean, across all concurrent requests) |
28 | Transfer rate: 1253.98 [Kbytes/sec] received |
29 |
30 | Connection Times (ms) |
31 | min mean[+/-sd] median max |
32 | Connect: 0 1 3.0 0 11 |
33 | Processing: 482 1658 1255.6 1049 4221 |
34 | Waiting: 472 1614 1263.7 975 4193 |
35 | Total: 482 1659 1256.4 1049 4222 |
36 |
37 | Percentage of the requests served within a certain time (ms) |
38 | 50% 1049 |
39 | 66% 2017 |
40 | 75% 2031 |
41 | 80% 2031 |
42 | 90% 4219 |
43 | 95% 4220 |
44 | 98% 4222 |
45 | 99% 4222 |
46 | 100% 4222 (longest request) |
2015-12-14 18:57测试结果
将动态列表的id采用redis查询机制后的测试结果
01 | [root@AY131127173600769912Z ~]# ab -t 10 -c 20 "http://www.zuidaima.com/" |
02 | This is ApacheBench, Version 2.0.40-dev <$Revision: 1.146 $> apache-2.0 |
03 | Copyright 1996 Adam Twiss, Zeus Technology Ltd, http://www.zeustech.net/ |
04 | Copyright 2006 The Apache Software Foundation, http://www.apache.org/ |
05 |
06 | Benchmarking www.zuidaima.com (be patient) |
07 | Finished 187 requests |
08 |
09 |
10 | Server Software: nginx/1.5.6 |
11 | Server Hostname: www.zuidaima.com |
12 | Server Port: 80 |
13 |
14 | Document Path: / |
15 | Document Length: 92916 bytes |
16 |
17 | Concurrency Level: 20 |
18 | Time taken for tests: 10.57819 seconds |
19 | Complete requests: 187 |
20 | Failed requests: 0 |
21 | Write errors: 0 |
22 | Total transferred: 17428925 bytes |
23 | HTML transferred: 17383241 bytes |
24 | Requests per second: 18.59 [#/sec] (mean) |
25 | Time per request: 1075.703 [ms] (mean) |
26 | Time per request: 53.785 [ms] (mean, across all concurrent requests) |
27 | Transfer rate: 1692.22 [Kbytes/sec] received |
28 |
29 | Connection Times (ms) |
30 | min mean[+/-sd] median max |
31 | Connect: 0 0 0.2 0 1 |
32 | Processing: 260 1038 535.8 961 6218 |
33 | Waiting: 225 987 536.5 916 6217 |
34 | Total: 260 1038 535.9 961 6219 |
35 |
36 | Percentage of the requests served within a certain time (ms) |
37 | 50% 959 |
38 | 66% 1116 |
39 | 75% 1220 |
40 | 80% 1255 |
41 | 90% 1514 |
42 | 95% 1732 |
43 | 98% 2194 |
44 | 99% 2470 |
45 | 100% 6219 (longest request) |
感觉性能变化不大,期待后续的优化。
加一个100并发的测试用例,为以后优化有个参考:
01 | [root@AY131127173600769912Z ~]# ab -t 10 -c 100 "http://www.zuidaima.com/" |
02 | This is ApacheBench, Version 2.0.40-dev <$Revision: 1.146 $> apache-2.0 |
03 | Copyright 1996 Adam Twiss, Zeus Technology Ltd, http://www.zeustech.net/ |
04 | Copyright 2006 The Apache Software Foundation, http://www.apache.org/ |
05 |
06 | Benchmarking www.zuidaima.com (be patient) |
07 | Finished 126 requests |
08 |
09 |
10 | Server Software: nginx/1.5.6 |
11 | Server Hostname: www.zuidaima.com |
12 | Server Port: 80 |
13 |
14 | Document Path: / |
15 | Document Length: 95415 bytes |
16 |
17 | Concurrency Level: 100 |
18 | Time taken for tests: 10.20080 seconds |
19 | Complete requests: 126 |
20 | Failed requests: 0 |
21 | Write errors: 0 |
22 | Total transferred: 12118461 bytes |
23 | HTML transferred: 12087357 bytes |
24 | Requests per second: 12.57 [#/sec] (mean) |
25 | Time per request: 7952.444 [ms] (mean) |
26 | Time per request: 79.524 [ms] (mean, across all concurrent requests) |
27 | Transfer rate: 1181.03 [Kbytes/sec] received |
28 |
29 | Connection Times (ms) |
30 | min mean[+/-sd] median max |
31 | Connect: 0 10 11.3 3 26 |
32 | Processing: 1812 3970 1323.1 3777 8118 |
33 | Waiting: 1724 3912 1317.0 3700 8117 |
34 | Total: 1812 3981 1324.4 3799 8121 |
35 |
36 | Percentage of the requests served within a certain time (ms) |
37 | 50% 3799 |
38 | 66% 4518 |
39 | 75% 4793 |
40 | 80% 4934 |
41 | 90% 5868 |
42 | 95% 6512 |
43 | 98% 7101 |
44 | 99% 7380 |
45 | 100% 8121 (longest request) |
- 等 最代码怎么获取牛币啊?
- 完 谁来告诉我最代码上线的时间,答对者给5牛币,先来先得
- 等 牛友们,大家好,你们做程序员多久了?现在还好吗?
- 完 在微信打开的页面里进行app下载
- 等 最代码2014年欢乐聚声会
- 完 mysql如何查询表数据并且对3个字段降序的SQL?
- 完 最代码牛币机制改革
- 完 成功的在bae上使用了自定义运行环境 jetty+nginx的组合,大家对jetty+nginx优化有哪些心得?
- 完 进来分享一下各位牛牛是如何加入最代码大家庭的?
- 等 为什么java BufferedImage类处理大图直接抛出内存溢出的异常?
- 等 最代码是否开发手机app客户端?
- 完 java程序员学习哪些java的技术?java有哪些框架?都能做哪方面的开发?
- 等 php格式网页文件怎么运行?
- 等 Java volatile值获取的问题
- 等 前端vue,拦截了登录后台后,返回的token,requests拦截token,但是发送请求的时候,就出现跨越异常
- 等 大专本科计算机科班怎么找到Java工作?
- 等 eclipse怎么把三个java swing游戏项目合成一个项目?
- 完 伙伴们,大家都有什么好的解压方式么,分享一下~
- 完 三四线城市,6、7k,运维工作,索然无味,想去辞职上培训,各位牛牛有什么建议嘛
- 等 jsp页面输入中文变成问号
- 等 JPA在线上运行一段时间后报错Caused by: java.lang.IncompatibleClassChangeError: null
- 等 PHP 这个规则用preg_match_all怎么写
- 等 大佬们,有没有知道Alfresco如何配置LDAP登录呢?
- 等 php的install目录是框架带的吗?
 相关问答
相关问答
 最近浏览
最近浏览
CrystalQ LV8
2020年11月4日

逆袭 奋起 LV4
2019年7月12日
嘻嘻哈哈希 LV3
2019年5月17日

httv52 LV1
2018年5月7日
padorasword1 LV2
2018年3月9日
yuxiubin
2018年1月19日
暂无贡献等级
jiuyun LV2
2018年1月11日
asdfghjklrrrjimisun LV12
2017年11月11日
tcx1748 LV2
2017年8月9日
kenhomeliu LV29
2017年7月18日